Is this difference significant?
October 8th, 2026
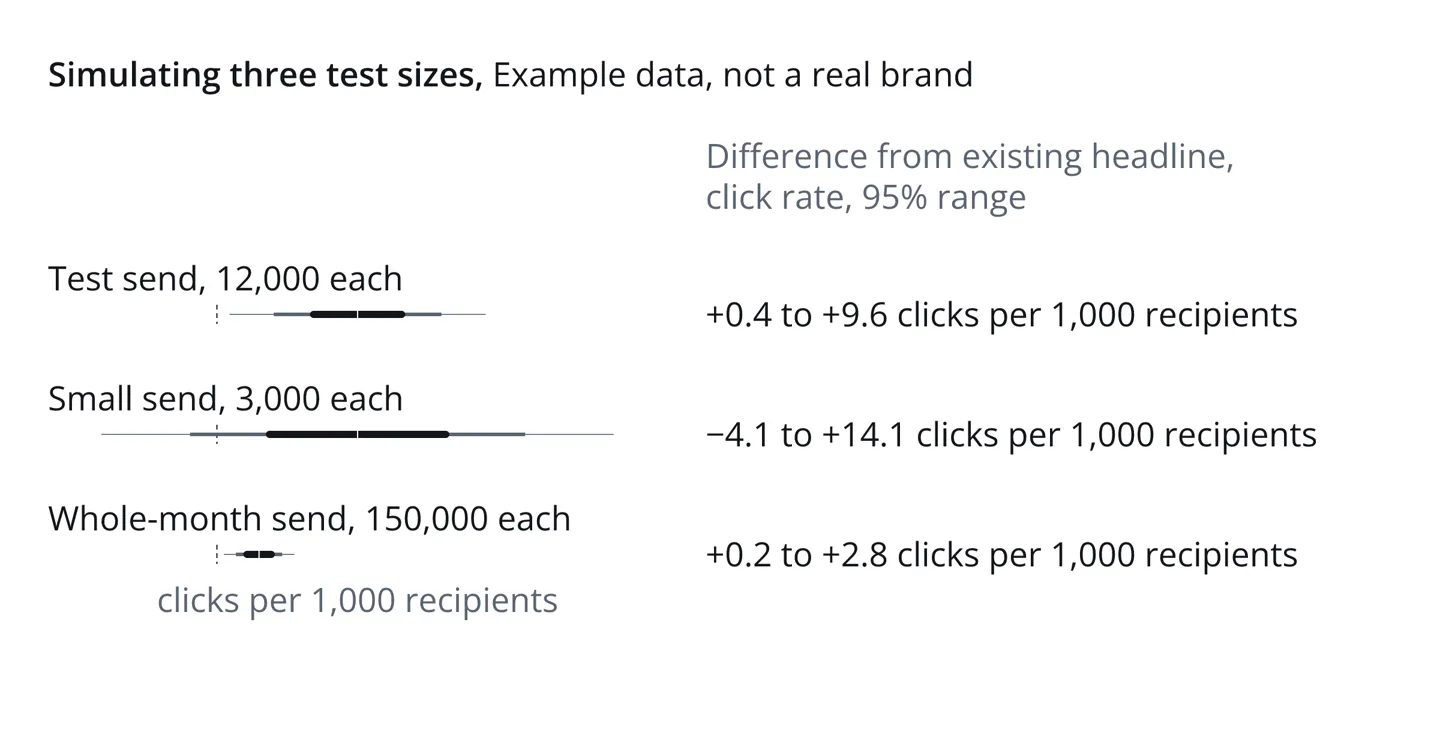
The same test, three list sizes. Width shows how sure; position shows how big. The narrowest range is also the smallest difference.
Significance asks whether chance alone could explain a difference. Marketers usually want to know how big it is and whether to act now. We use an approach that answers the marketer's questions more directly.
Is this difference significant?
A marketer looks at two click rates and asks whether the difference is significant. Two questions usually sit inside the one:
- Could chance explain it?
- Should I act now, or wait?
Significance answers the first, carefully and narrowly. The second needs two answers it does not give: how big the difference is, and the likely cost of inaction.

The same test answers two questions. A test of significance answers the first with a yes or no. A decision needs the second, which a range and the decision measures answer.
What significance means
A "significant" difference is one that is hard to explain by chance alone.
Significance asks "If there were truly no difference between the two versions, how often would a test this size show a gap at least as large as this?" If that value falls below a threshold chosen before starting, the result is deemed "significant". The most common threshold value is 1 in 20. This means about 1 in 20 test results are called "significant" even when it is testing versions that truly do not differ.
The guarantee behind the standard version of this test holds only if the number of recipients was fixed before the test and the result is read once, at the end.
Simulated examples
Let's look at some simulated data, not a real brand.
Let's say a brand sends to 300,000 recipients a month, and its subject line today earns a click rate near 3.1%. For our simulation, we say urgency increases clicks in all cases. In a test send of 12k recipients and a small send, we'll simulate it increasing the click rate by 0.5%. In a whole month send, let's say it increased the click rate by only 0.15%.
The counts
| Send | Recipients per version | Today's clicks | Urgency clicks | Today's rate | Urgency rate |
|---|---|---|---|---|---|
| The test send | 12,000 | 372 | 432 | 3.1% | 3.6% |
| The small send | 3,000 | 93 | 108 | 3.1% | 3.6% |
| The whole-month send | 150,000 | 4,650 | 4,875 | 3.1% | 3.25% |
What the test says
The table prints the test's own output for each send, at its 0.05 threshold. A verdict below is the test's, not ours.
| Send | Difference, clicks per 1,000 recipients | p-value | The test's verdict at 0.05 |
|---|---|---|---|
| The test send | +5.0 | 0.031 | Significant |
| The small send | +5.0 | 0.28 | Not significant |
| The whole-month send | +1.5 | 0.019 | Significant |
How each figure is computed
The significance values above come from the standard test for comparing two rates. The test is two-sided, and it uses the click rate of both versions combined. Some calculators add a correction for clicks being whole numbers. That correction gives slightly larger p-values, in this case that correction doesn't change verdict.
What significance does not tell you
This is an important test that is often misread. Three things to note are:
- It is not the chance the difference is real. A p-value of 0.031 is the chance of a gap this large if there were no difference. It is not a 97% chance that urgency is better.
- It says nothing about the size of the difference. The whole-month send has a smaller p-value than the test send. It also has a smaller difference. With enough recipients, any nonzero gap becomes significant: significance can be reached by a difference too small to be worth acting on.
- "Not significant" is not "no difference." The small send shows the same +5 per 1,000 as the test send, and its p-value is 0.28. The test did not find no difference; it found too few recipients to rule out chance.
Why we answer differently
Significance is a sound tool, but it is built for a different decision than the one a marketer makes each week.
You need to know how big the difference is
Whether to change the next send depends on what the change is worth, and a significance test does not say; it answers only whether the gap can be told apart from zero. The second misreading shows the test is silent on size, and the size is what the decision turns on. Across 150,000 recipients, +5 clicks per 1,000 is about 750 more clicks, and +1.5 is about 225, yet the second has the smaller p-value. The range answers the question the decision rests on: how big the difference could be, from its smallest plausible value to its largest.
The decision can be undone
Significance puts the burden of proof on change: the standard version stays until a challenger is shown to be clearly better. That is right for a drug, a food crop, or a factory line, where switching is expensive and slow. Email is the opposite case, because change is easy and reversible. Holding the old version until the evidence clears a bar has a cost too: every send while you wait goes out with what may be the weaker version. A decision has to weighs two costs, acting on a wrong answer (inaccuracy) and waiting too long (inaction). A fixed threshold weighs only the first.
Results arrive send by send, and reading them as they arrive breaks the guarantee
The standard 1-in-20 guarantee assumes one look, at a size fixed in advance. Each extra look raises the chance that a test of versions that truly do not differ is called significant at least once. If each test is read after each of ten equal batches and stopped at the first significant reading, about 1 in 5 such tests end up called significant. With enough looks, more than half do.1 Marketers check results as they arrive, which is reasonable, and the standard test was not built for it. Test designs exist that allow repeated looks, but they require more recipients for the same threshold.
Our ranges make no 1-in-20 promise. They state what the sends so far show, and reading them after every send does not change what they say. Looking often is not free, though: stopping the moment a range looks good still favors lucky streaks, which is why the measures weigh what is at stake rather than a line to cross.
What we show instead
The three sends from the example, with their ranges and chances instead of significance verdicts:
| Send | 95% range, clicks per 1,000 recipients | 95% range, clicks a month | Chance urgency is ahead |
|---|---|---|---|
| The test send | +0.4 to +9.6 | +120 to +2,880 | 98% |
| The small send | −4.1 to +14.1 | −1,230 to +4,230 | 86% |
| The whole-month send | +0.2 to +2.8 | +60 to +840 | 99% |
Marketers running experiments often need to consider what acting now gives up, and what waiting buys? This question has numbers of its own.
Take the test send. Its shows a wide range, that favors the urgency title. The range is as wide as it is because of how many recipients it reached, more recipients would narrow it. The chance of direction is the share of plausible differences above zero. It is high, but short of certain.
Is a range clear of zero the same as significant?
The numbers often land close, but you should think of them differently.
In a simple test like this one, a range clears zero in almost all the cases the significance test at 0.05 calls "significant". The chance urgency is behind is about half the p-value: for the test send, the chance is 1.6%, and half of 0.031 is 0.016.
But, the meaning differs. The p-value is about the data, assuming no difference. The range and the chance are about the difference, given the data. "If there were no difference, a gap this large would be rare" and "the difference is very likely above zero" are different sentences that happen to share a number here.
Where the two part ways
The numbers part ways in three common cases.
- When a report folds in earlier tests, its range can be narrower or shifted.
- When results are read after each send, the p-value's guarantee is gone, and the range's statement is unchanged.
- When there are more than two versions, the significance test needs a correction for each extra pair it compares, while the decision measures are computed for all versions at once, so there is no pair-by-pair threshold to correct.
For an article focusing on the timing of these decisions, see my How to Tell When You Have Enough Data to Act.
Those figures come from P. Armitage, C. K. McPherson and B. C. Rowe, "Repeated Significance Tests on Accumulating Data," Journal of the Royal Statistical Society, Series A, 1969.